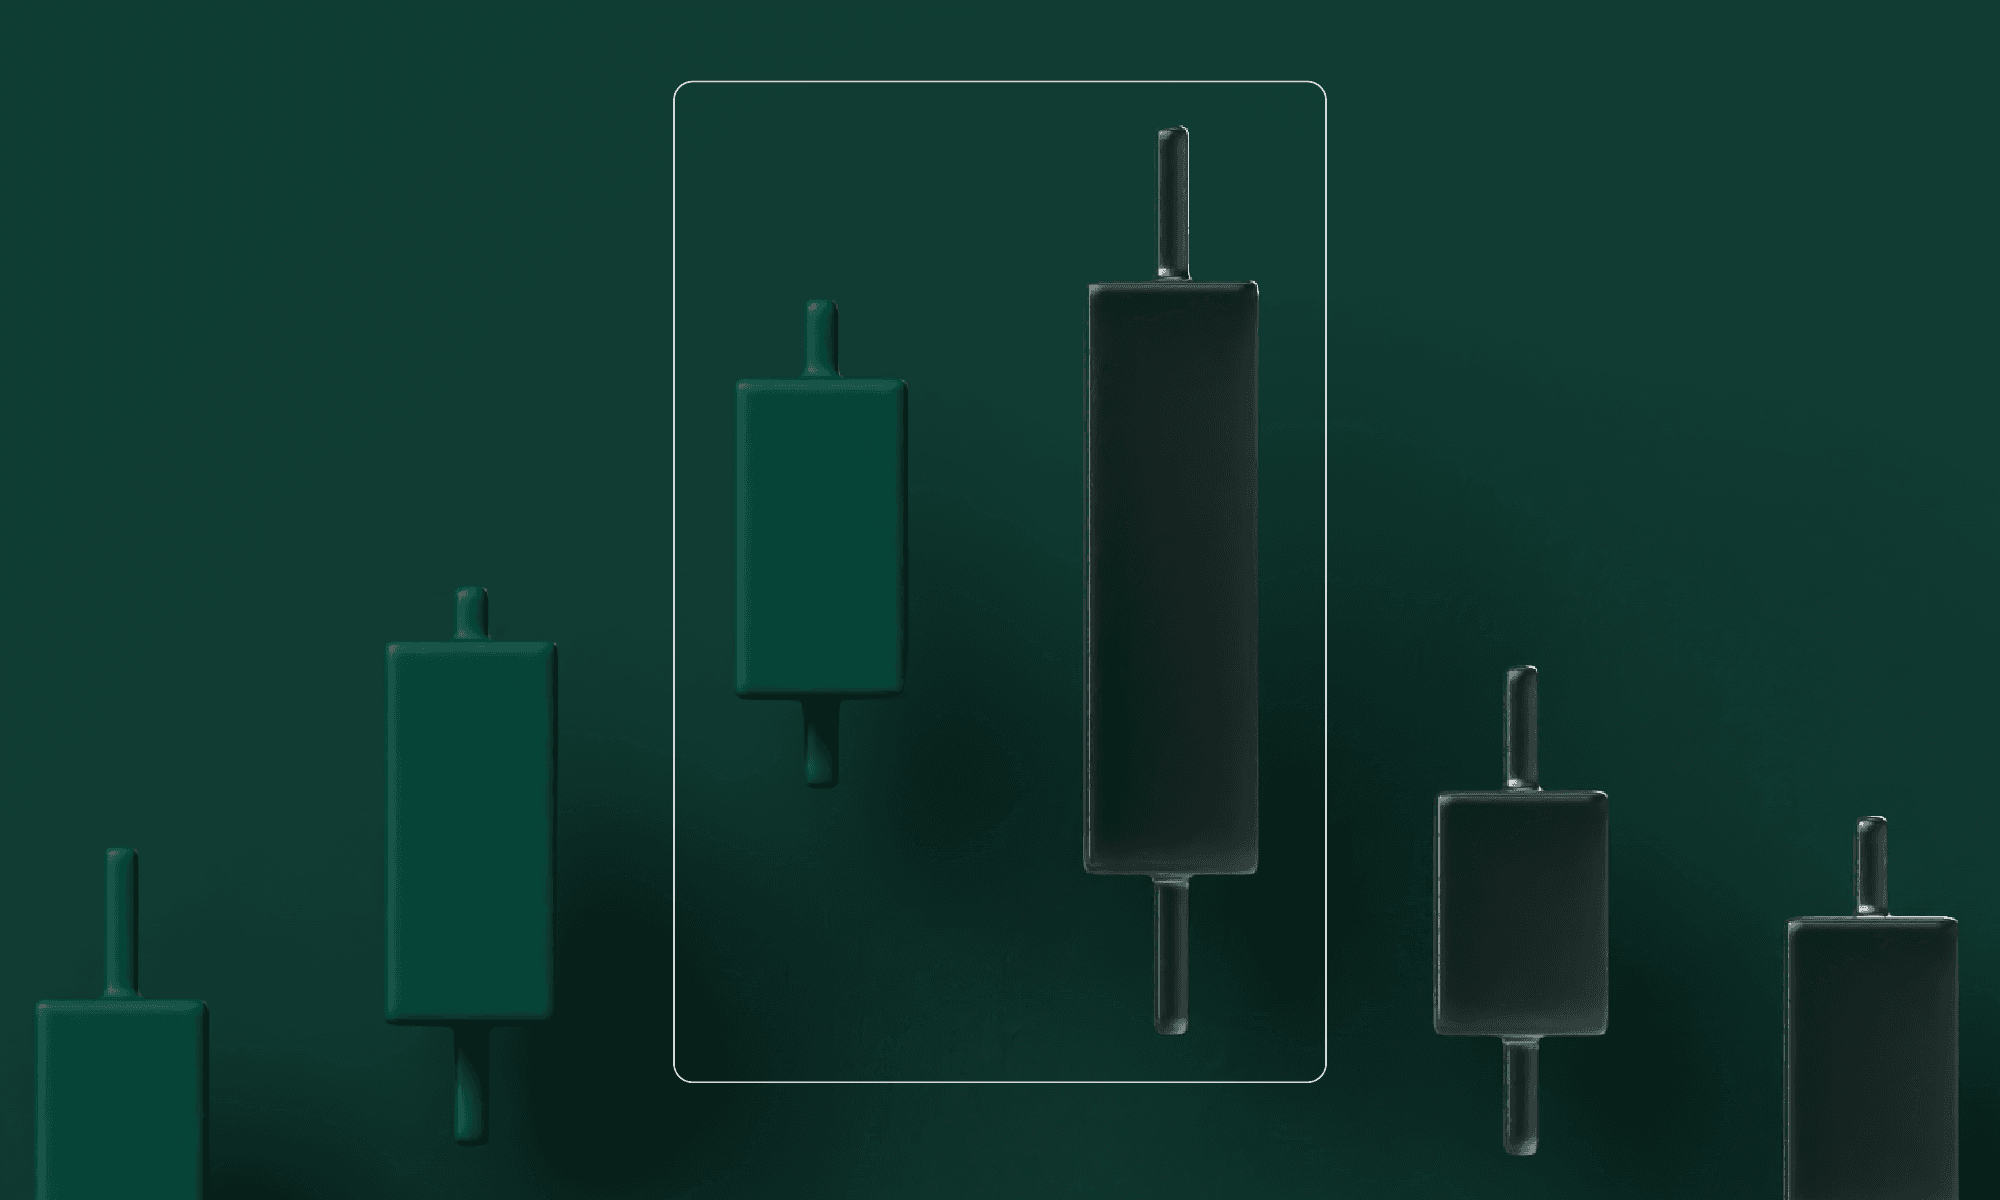
A typical example of a bullish candlestick pattern is the Bullish Engulfing pattern. In this formation, a large bullish candle completely “engulfs” the body of the previous, smaller bearish candle. The Bullish Engulfing pattern often occurs after a downtrend and is considered a sign of an upcoming trend reversal.
Other examples of bullish candlestick patterns include:
Hammer Candlestick
Bullish Engulfing Candlestick
Piercing Line Candlestick
Bullish Mat Hold Candlestick
Morning Doji Star Candlestick
Bullish Harami Candlestick
You can find details and specific use cases for bullish trading candlestick patterns in our guide to bullish candlestick patterns.
How to Read Candlestick Charts Correctly
Understanding how the different candlesticks are formed and how they relate to one another in the chart is an important part of the technical analysis of your assets. This can help you assess potential price movements.
How to read candlestick charts:
Identify the trend: Observe the sequence of candlesticks to determine whether the market is in an uptrend, a downtrend, or moving sideways.
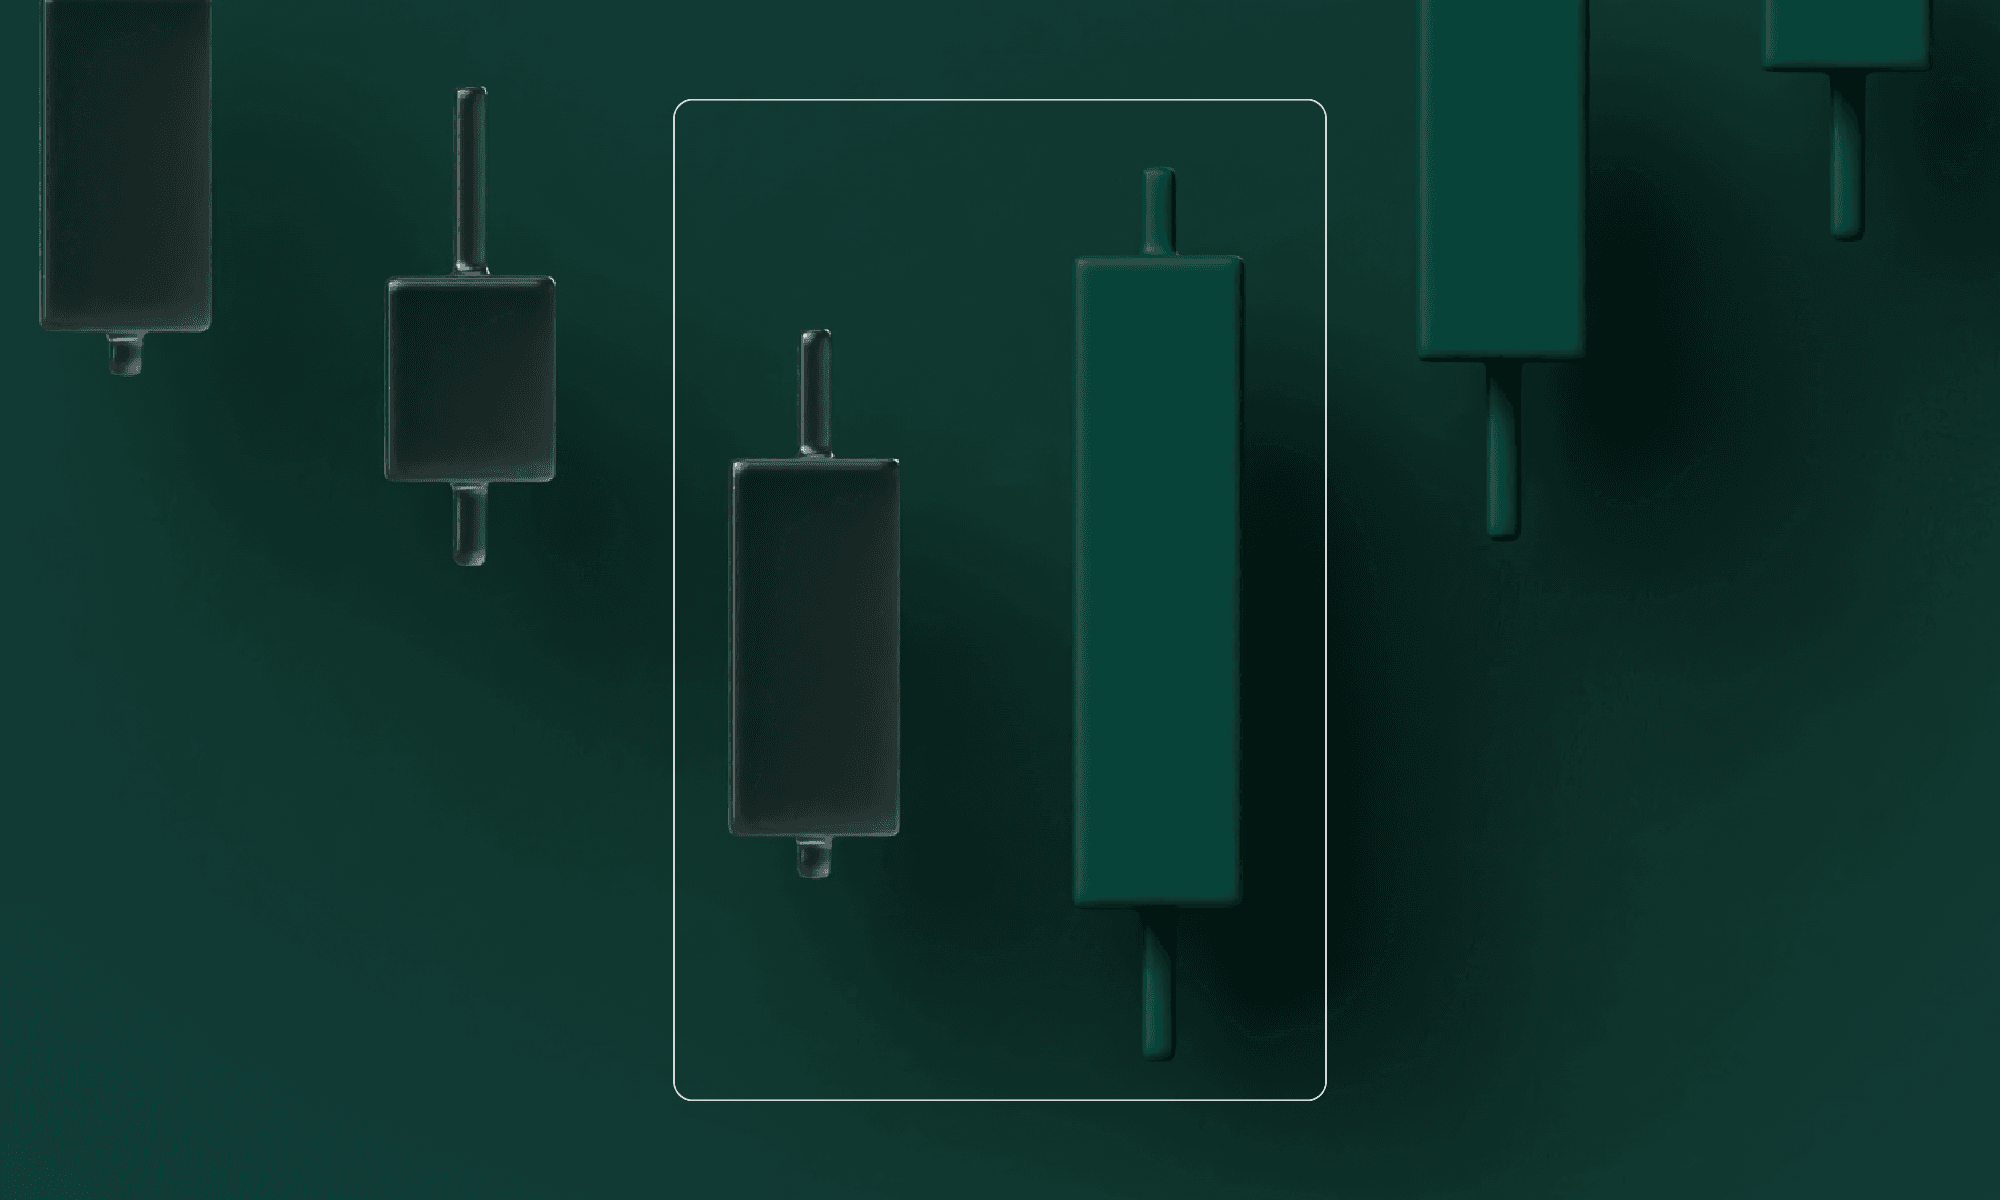
Identify candlestick patterns: Look for specific trading candlestick patterns, such as the Bullish Engulfing pattern, which points to a potential trend reversal after a downtrend, or the Bearish Engulfing pattern, which often signals an upcoming downtrend.
Understand the timeframe: Keep in mind that the timeframe, such as hours, days, or weeks, can influence the meaning of individual candlestick formations. A bearish pattern on a weekly chart is often more meaningful than the same pattern on an hourly chart.
Timeframes in Candlestick Charts
The timeframe of a candlestick chart determines what period a single candle represents. Depending on the chart, candlesticks can represent one minute, one hour, one day, or one week, for example.
Different timeframes are used for different trading approaches:
Minute charts show short-term price movements.
Hourly charts are often used for short-term swing trading.
Daily and weekly charts are generally better suited for analyzing long-term trends.
The significance of a candlestick pattern can also change depending on the timeframe. Many traders give formations on daily or weekly charts more weight than patterns on very short timeframes, because short-term price movements are often more volatile.
Technical Analysis with Candlestick Charts
Candlestick charts are among the best-known tools for technical analysis using candlesticks. Traders analyze past price movements to better assess possible trends and changes in market sentiment. Please always keep in mind: past price performance is not an indicator of future performance.
Candlestick chart patterns are often combined with other indicators, including:
Well-known trading candlestick patterns such as Hammer, Doji, or Engulfing can provide clues about possible upward or downward trends. Traders therefore often use candlestick analysis as part of their trading strategy to evaluate price movements in a more structured way.
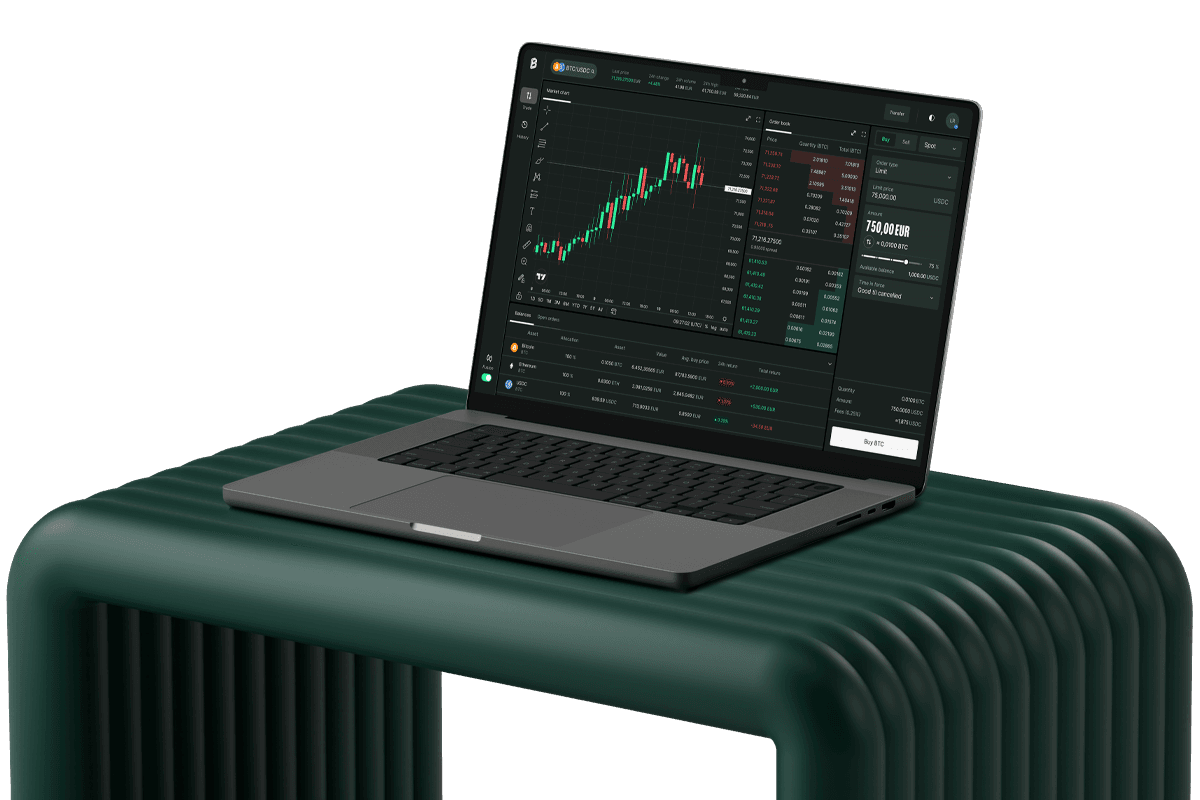
Do you already have experience in crypto trading and want to refine and expand your strategies? With Bitpanda Fusion, you get access to a platform specifically tailored to the needs of active traders—ideal for frequent trading and larger trading volumes. Benefit from advantages such as zero transaction fees, fast upgrades, real-time analytics, and the highest security standards. Rely on Bitpanda Fusion’s professional charting tools and take your trading to the next level.