This chart formation is often interpreted as the bears overpowering the bulls, with selling pressure rising. While the hanging man may occasionally appear within an uptrend, it often indicates that a reversal is imminent. For traders speculating on falling prices, the hanging man formation is a useful signal for a well-timed entry or exit.
6. Bearish engulfing candle
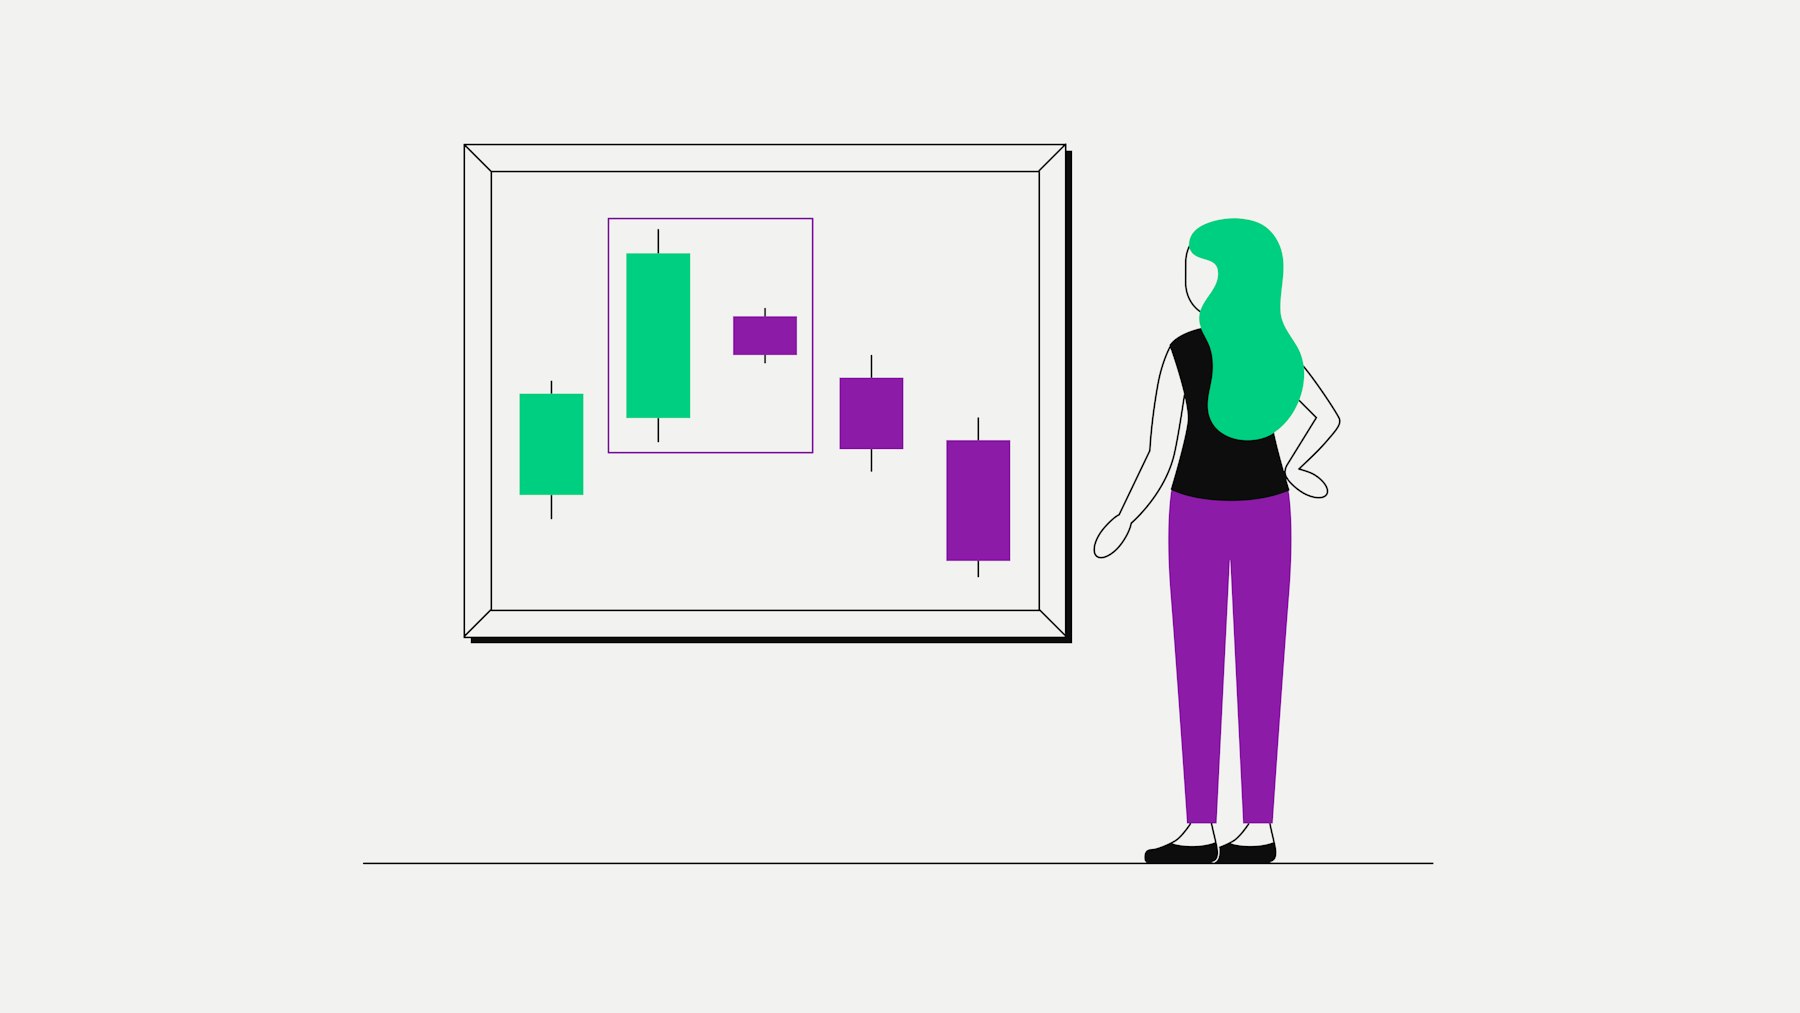
The bearish engulfing candle is a two-day reversal pattern made up of a smaller green candle followed by a larger red candle. The red candle engulfs the body of the green candle entirely, indicating that the bears are dominating the market. This sudden shift from buying to selling pressure often signals a trend reversal, especially when the pattern appears after a prolonged uptrend.
For traders in crypto trading, the bearish engulfing candle provides a strong signal that the upward movement is losing momentum and a downtrend could be imminent. This formation is frequently an entry signal for short positions or an opportunity to hedge existing positions.
7. The evening star
The evening star pattern is a three-part bearish candlestick pattern that signals a potential trend reversal from an uptrend to a downtrend. It consists of a larger green candle, followed by a small candle (often a doji), and a final larger red candle body. This configuration shows that initial buying pressure is gradually fading as the bears take control.
The small candle in the middle of the formation indicates market indecision, and the following red candle confirms the reversal by closing below the body of the first candle. In crypto trading, the evening star pattern is often seen as a sign that the upward movement has exhausted itself and a downtrend may be ahead. This formation gives traders the chance to consider sell positions or secure profits.
8. Shooting star
The shooting star is a bearish candle pattern that often appears near the end of an uptrend and signals a possible reversal. This pattern features a candle with a small body near the day’s low and a long upper shadow. The long shadow shows that the bulls initially pushed the price up significantly, but the bears regained control and drove the price back down.
The shooting star formation suggests that buying interest is waning while selling pressure is increasing, providing a potential signal for traders to prepare for a downward movement. In crypto trading, this chart pattern is often used as an indicator of an upcoming trend reversal, especially when it follows a strong upward trend.
9. Bearish doji star
The bearish doji star is a candlestick formation that commonly appears at the end of an uptrend and signals a potential trend reversal. It consists of a larger green candle followed by a doji candle, which indicates market uncertainty. The doji candle opens above the closing price of the first candle, but the candle body closes at nearly the same level, suggesting a loss of buying pressure.
This bearish candlestick pattern shows that the bulls are struggling to push the price higher. The formation indicates a possible reversal if the next trading day features a red candle. For crypto traders, the bearish doji star can be an important warning signal that a downward movement may be imminent and that selling pressure is increasing.
10. Gravestone doji
The gravestone doji is a distinctive candlestick pattern recognisable by its shape: it consists of a long upper shadow and a barely visible or completely absent lower shadow, with the opening and closing prices being identical or nearly so. This formation occurs when the price rises sharply during the session, but the bears gain control by the end and push the price back to the opening level.
The long upper shadow signals an attempt by the bulls to drive the market higher, but without long-term success. The absence of a lower shadow in the formation shows there was little buying pressure to support the price after it dropped. This bearish candlestick pattern is often a strong indication that buying interest has been exhausted and a downtrend may be imminent.
In crypto trading, the gravestone doji is seen as a significant warning signal at the end of an uptrend, as it suggests that the bears have taken control and a reversal into a downtrend is likely.
How bearish candlestick patterns are used in trading
Bearish candlestick patterns are used in trading to identify potential trend reversals and ideal entry or exit points for short positions. They indicate that selling pressure is increasing and a downtrend may be approaching.
Traders analyse these patterns especially in combination with other trading indicators to confirm the likelihood of a reversal and to minimise risk.
Tips for using bearish candlestick patterns in crypto trading
Timeframe awareness: bearish patterns on longer timeframes such as daily or weekly charts are often more reliable than those on shorter timeframes.
Wait for confirmation: ideally, a bearish formation should be confirmed by another bearish candle or other indicators such as trading volume.
Don’t view in isolation: bearish candlestick patterns work best when combined with other technical analysis tools like trendlines or moving averages.
Secure positions: when identifying a bearish pattern, it may be sensible to set stop-loss orders to reduce risk in case of potential downward movements.
In crypto trading, bearish candlestick patterns are especially useful as the market is often volatile and quick decisions are required. Understanding such patterns helps traders better assess market movements and adjust strategies accordingly.