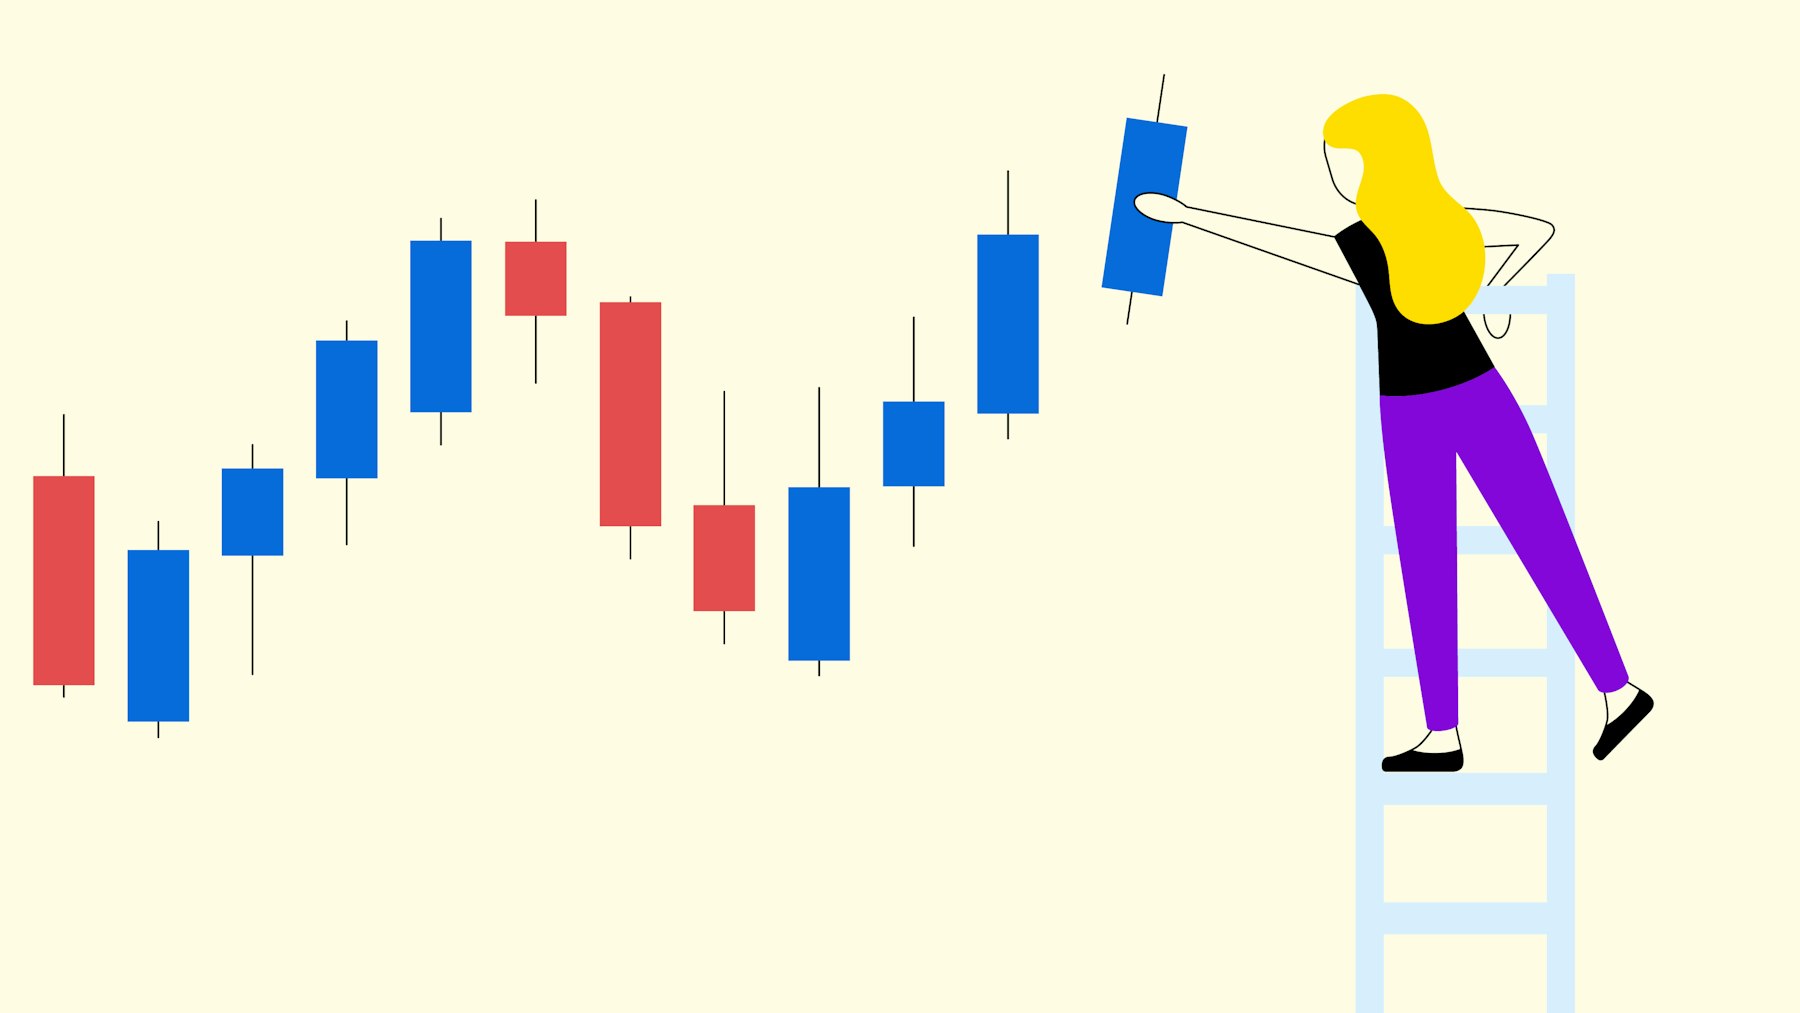
You can find details and specific examples of how to apply bullish candlestick trading patterns in our guide on bullish candlesticks.
How to read candlestick charts
Understanding how different candlesticks are composed and how they relate to each other in a chart is an important part of the technical analysis of your assets. This allows you to assess potential price movements and make more informed trading decisions.
How to Read Candlestick Charts:
Identify Trends: Observe the sequence of candlesticks to determine if the market is in an uptrend, downtrend, or sideways movement.
Identify Candlestick Patterns: Look for specific trading patterns, such as the Bullish Engulfing Pattern, which suggests a potential trend reversal after a downtrend, or the Bearish Engulfing Pattern, which often signals an imminent downtrend.
Understand Timeframes: Keep in mind that the timeframe (e.g., hours, days, or weeks) can affect the significance of individual candlestick formations. A bearish pattern on a weekly chart is often more meaningful than the same pattern on an hourly chart.
Timeframes in candlestick charts
The time unit of a candlestick chart defines how long a single candlestick represents the movement of a price. Commonly used time units are minutes, hours, days and weeks, with each time unit providing different information and perspectives. For example, a daily chart shows each day as a single candlestick, ideal for long-term traders who want to follow broader trends Minute or hourly charts, on the other hand, are popular with day traders as they show quick market movements and support short-term trading decisions.
The choice of time unit can influence the significance of the candlestick pattern. A Bullish Engulfing pattern on a daily chart usually has more significance than the same pattern on a five-minute chart, as longer time frames can provide stronger trend confirmations. Traders should therefore always choose the timeframe in the context of their strategy and objectives.
Technical analysis with candlestick charts
Candlestick charts are a vital tool in technical analysis, as they provide insights into both current price movements and potential trend reversals. In technical analysis, past price movements are examined to predict future price developments. Candlestick trading patterns such as the Hammer, the Bullish Engulfing Pattern, or the Doji Formation serve as indicators of potential upward or downward trends.
To perform a thorough analysis with candlestick charts, traders use multiple chart formations and indicators to detect market signals and combine them with other data, such as volume or moving averages. Analysing candle formations and identifying patterns can serve as a method for developing trading strategies based on price movements. This allows traders to make informed decisions in trading, thanks to candlesticks.
Conclusion: Successful trading with candlestick patterns
Candlestick patterns provide a basis for traders to recognise market movements and changes in sentiment at an early stage. Understanding candlestick patterns and formations such as the bullish engulfing pattern, doji, hammer and others makes it possible to identify trends and possible reversal points in the chart. By specifically reading and interpreting candlestick charts, traders can not only better interpret individual signals, but also apply more comprehensive technical analysis techniques.
For successful candlestick trading, it is important that you familiarise yourself with the different time frames and their influence on pattern reliability. In combination with other trading indicators, such as trading volume or moving averages, candlestick patterns help you to make informed decisions and better weigh up risks.
Frequently asked questions about candlesticks
Here you will find answers and explanations to the most frequently asked questions about candlesticks.
What Are Candlestick Formations?
Candlestick formations, or candle formations, are recurring patterns in candlestick charts that help traders forecast potential price movements. They consist of individual or multiple candlesticks and are used in technical analysis to identify bullish or bearish market sentiment at an early stage.
These formations often indicate whether an upward or downward movement is imminent. Some formations, such as the Engulfing Pattern or the Doji, suggest a potential trend reversal, while others, like the Hammer, indicate a continuation of the current trend. Candlestick formations are therefore a valuable addition to technical analysis, helping traders better understand market movements and make more informed trading decisions.
Is There a Difference Between Candlestick and Chart Formations?
Yes, there is a difference between candlestick and chart formations. Candlestick formations consist of individual candlesticks or a small series of candlesticks and indicate short-term changes in sentiment or potential trend changes. Typical candlestick formations are the bullish engulfing pattern, the hammer or the doji. These patterns tend to be small-scale and offer a quick assessment of market sentiment.
Chart formations, on the other hand, usually cover longer periods and are made up of a large number of candlesticks or other chart types. Examples of chart formations are the head and shoulders formation, the triangle or the double bottom. Chart formations help traders to recognise overarching trends and develop longer-term strategies. Together, candlestick formations and chart formations in trading can provide a more comprehensive picture of the market and support traders in technical analysis.
What Is the Best Candlestick Formation?
The question of the "best" candlestick formation cannot be answered definitively, as the reliability of a formation depends heavily on the specific market context and the timeframe. Commonly used and considered reliable formations include the Hammer, the Bullish Engulfing Pattern, and the Doji, as they often indicate potential trend reversals.
More trading topics
Interested in strategies to take control of your investments and capitalise on cryptocurrency trends? Explore our resources in the Bitpanda Academy for in-depth guides on blockchain, crypto trading, and more.
